“Challenge Accepted” is how the Education Outcomes Fund (EOF) has framed the publication of the results of the final evaluation of the Sierra Leone Education Innovation Challenge (SLEIC). In doing so, they recognised the risk and challenge that providers, partners, local government, school leaders and teachers took on through their participation in the government of Sierra Leone first programme in basic education.
We have written a lot in the past year about our desire to use this challenge as an opportunity to learn. As we move through our learning process we are committed to being transparent in sharing what we are learning and how we are learning it, in the hope that we can share and benefit from the wisdom of others.
In that light we wanted to share a detailed view of where we ended our challenge.
1 The Headlines
Our results are not what we would have hoped them to be.
In both maths and English, the learning gains in schools we supported as compared to control schools were lower than they had been when they were measured at the end of year two. In English the learning gains are small, and not statistically significant. Our learning gains in maths were larger, but still fell below the overall learning gains achieved by the SLEIC programme (shown later in Figure 2). This progress in results is shown in Figure 1.
At the end of the second year, we saw a significant gap in gains by sex, with girls improving far more relative to the control group then boys did, closing a significant baseline attainment gap. In both subjects this gap has narrowed, but unfortunately this is not just driven by improved learning gains for boys (in maths), but also by a sharp decrease in learning gains for girls (in maths).
Figure 1 - Maths and English Learning Gains by Sex
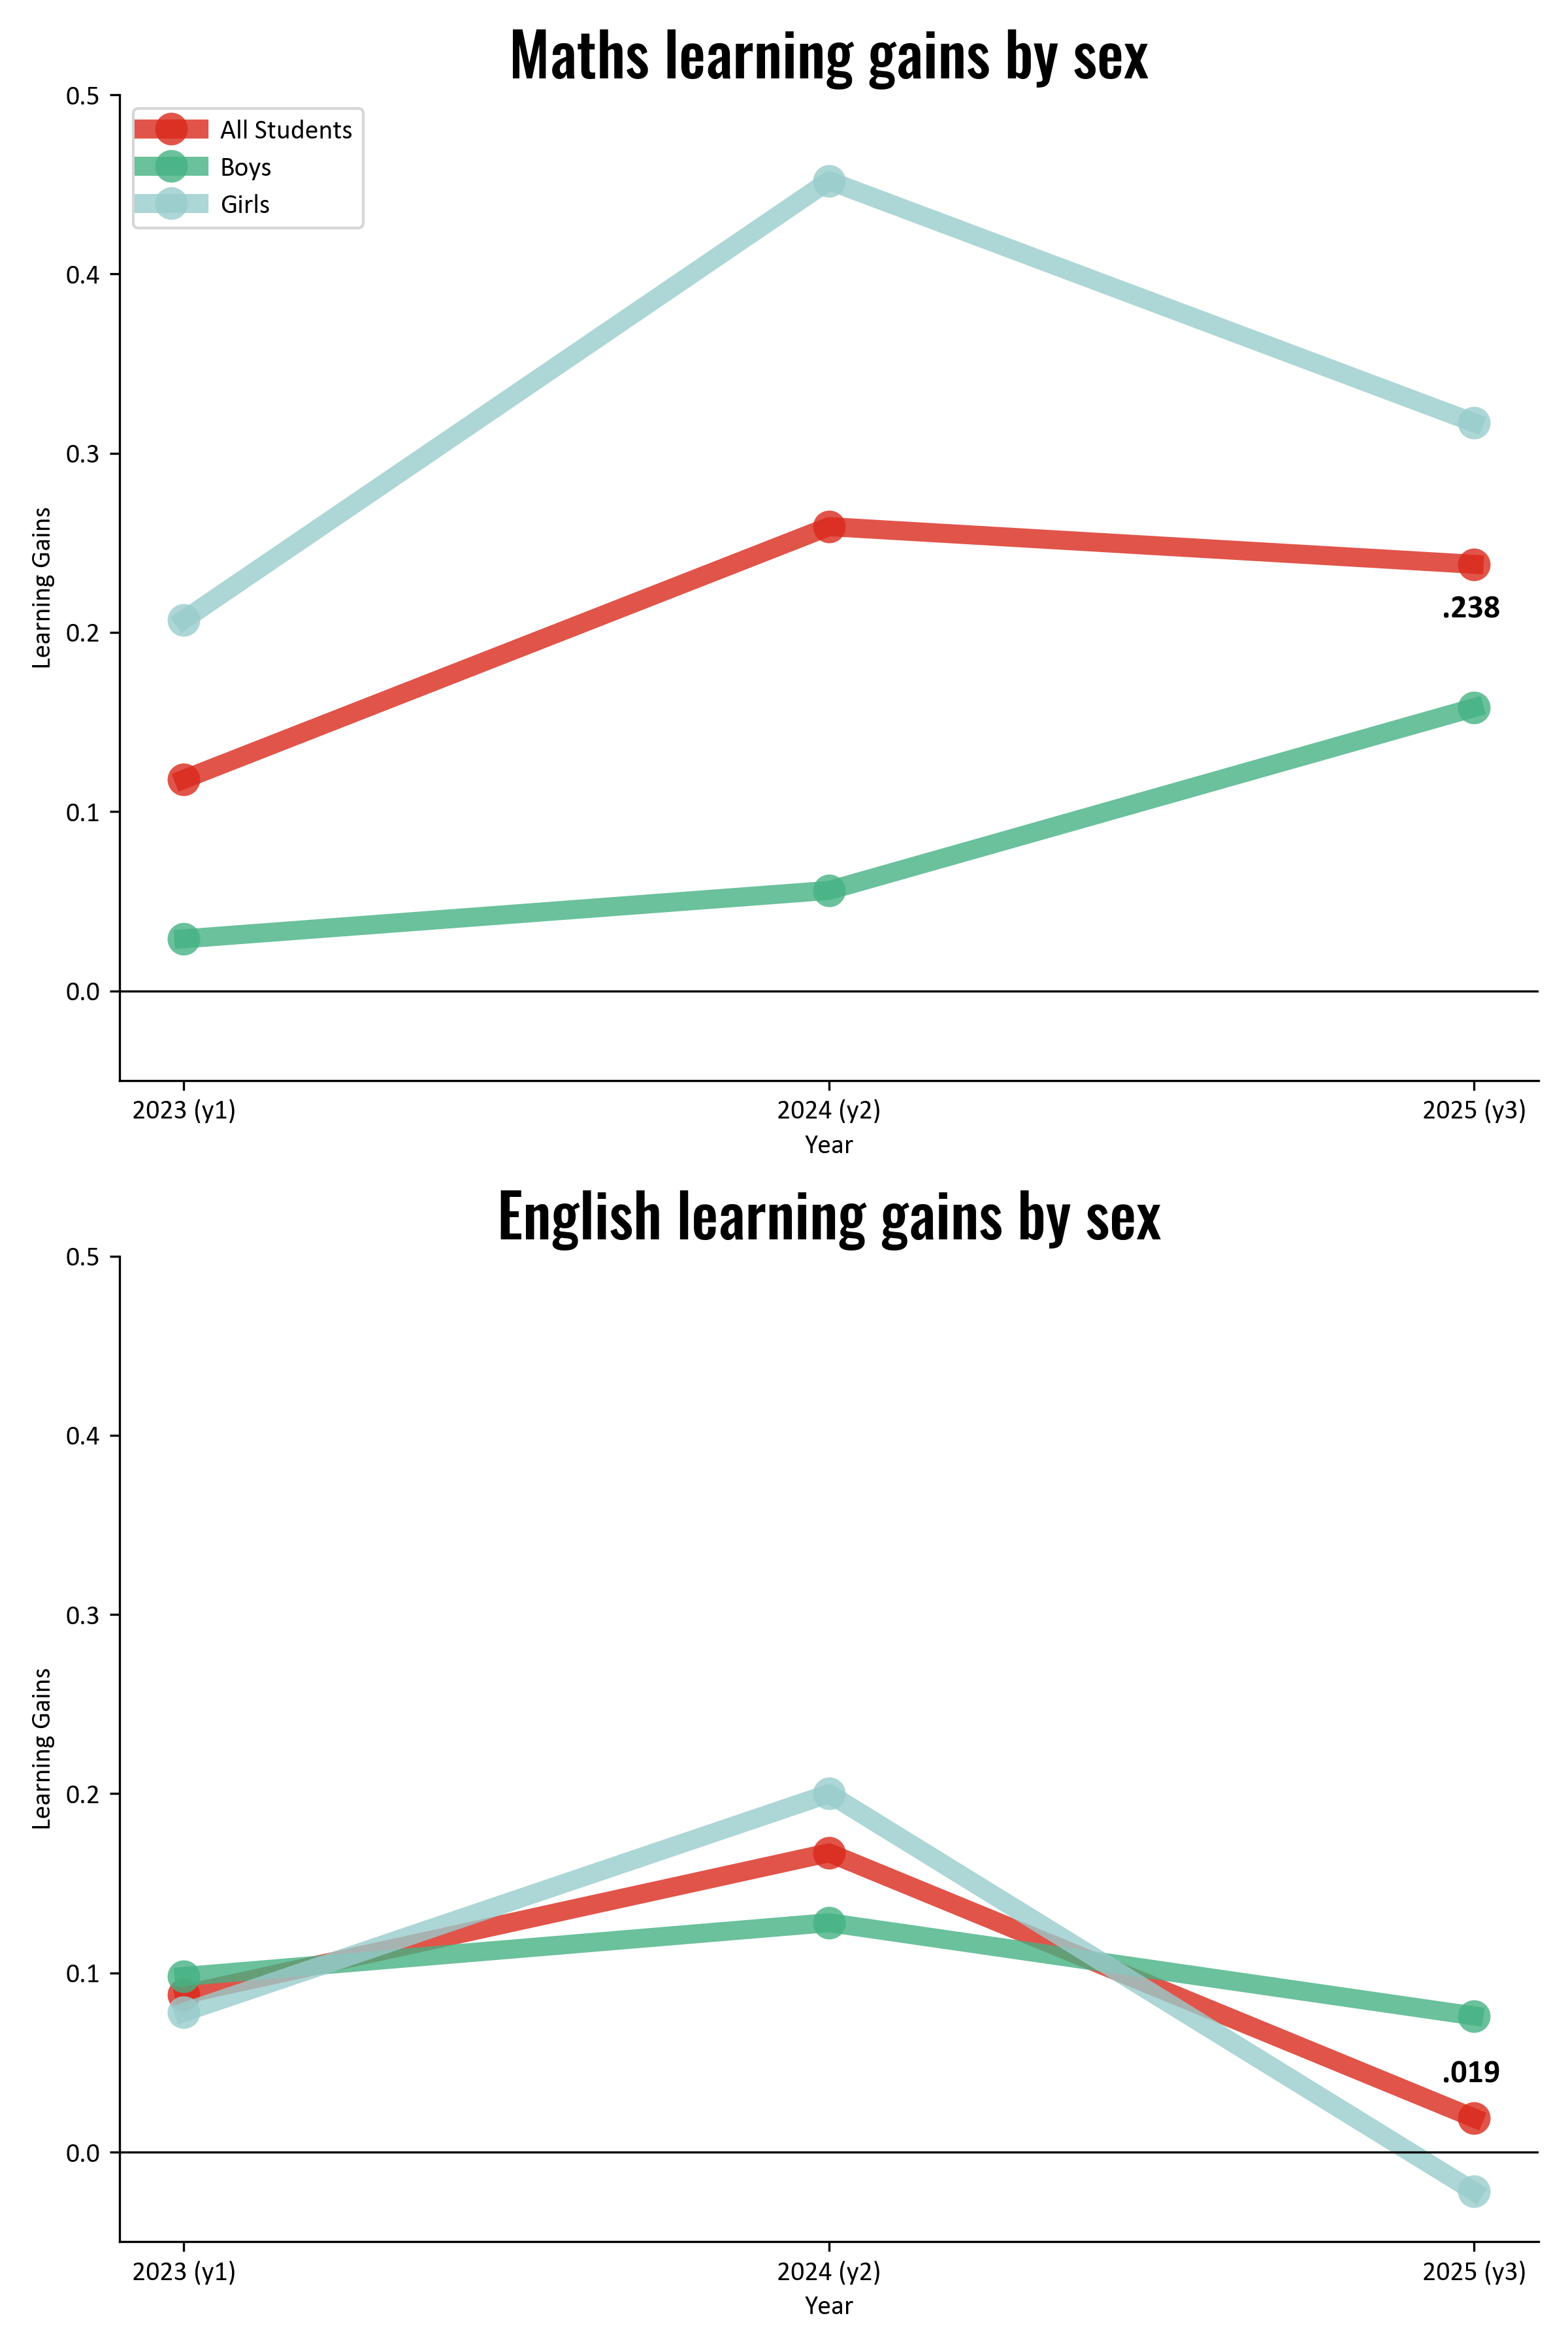
Note: all figures in this blog use Standard Deviation (SD) units.
2 Are these good results?
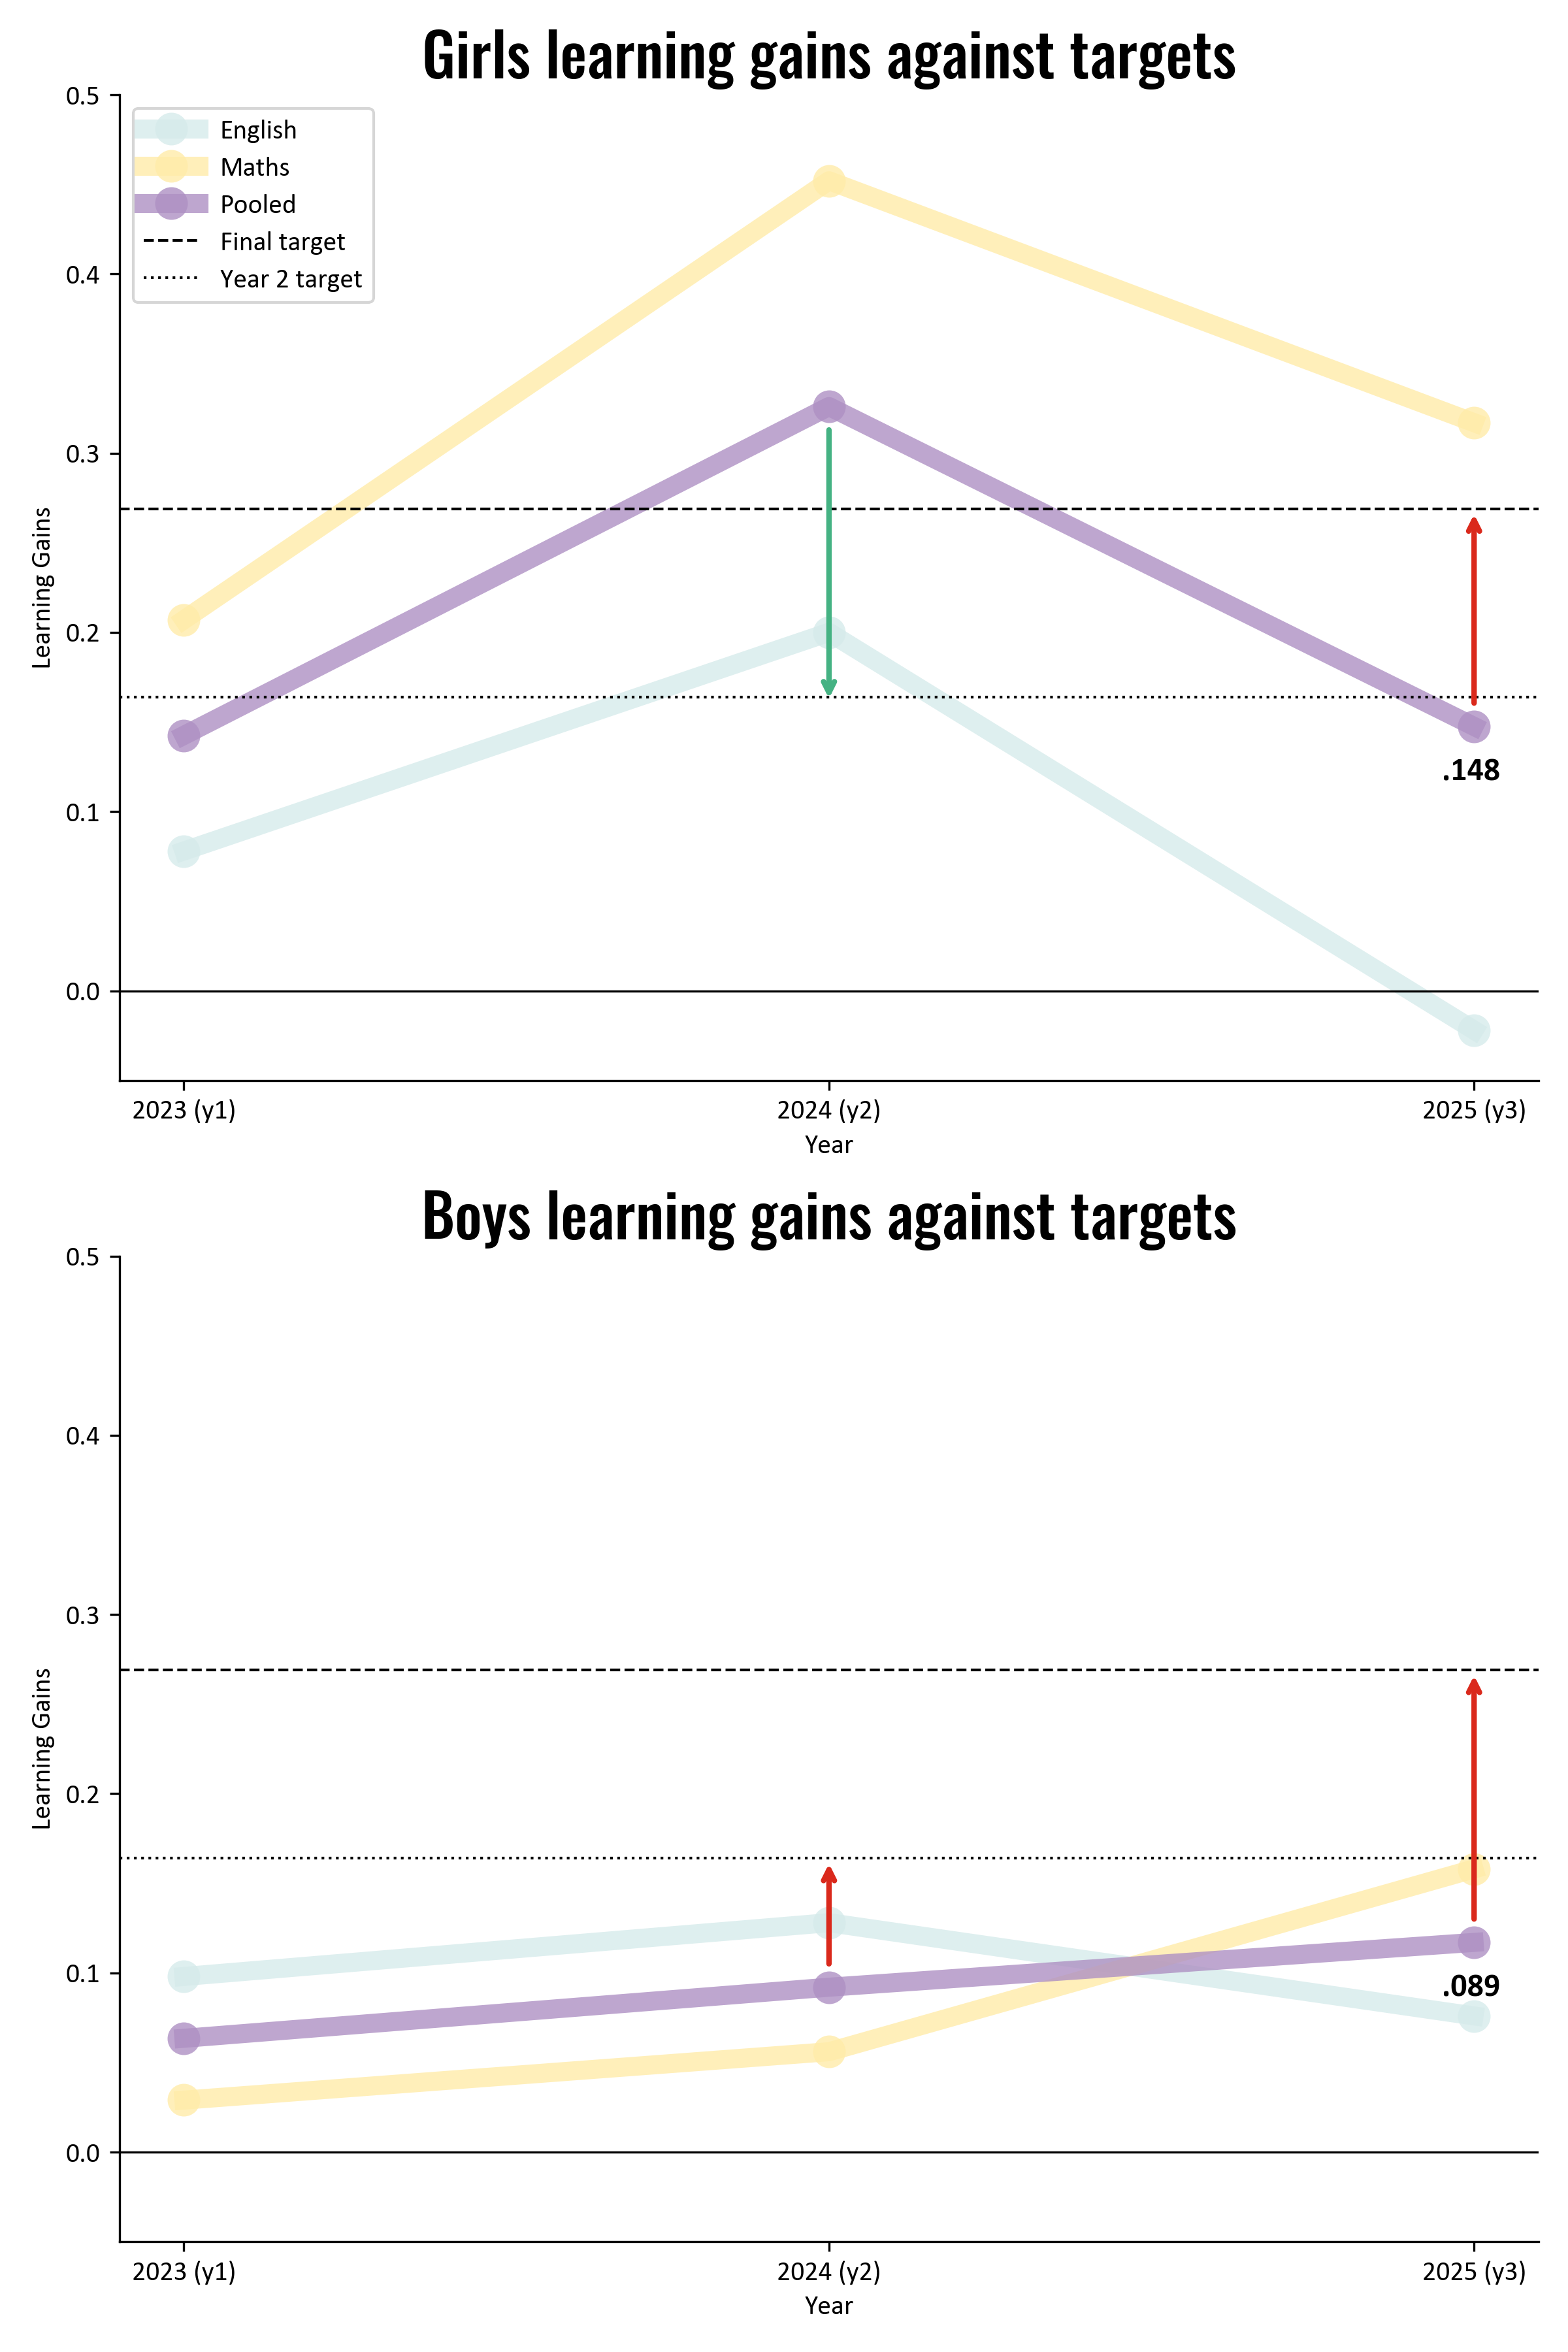
There are two unique characteristics of the SLEIC programme which allow us to contextualise these results further. Firstly we were assessed against pre-agreed targets, used for determining payment against the outcomes contract, and secondly we were one of five providers, with each provider being assessed through a parallel RCT, each with its own control group.
In comparison to our targets our results are far from what we would want them to be. Targets were assessed separately for girls and boys, pooling learning gains between maths and English. In Year 2 we were ahead of the targets for girls, and behind for boys. In Year three we were behind for both girls and boys. This means that we have received only a portion of our final payment, and will not recoup all of the budget that was invested in the programme.
Figure 2 - Girls and boys learning gains compared to targets
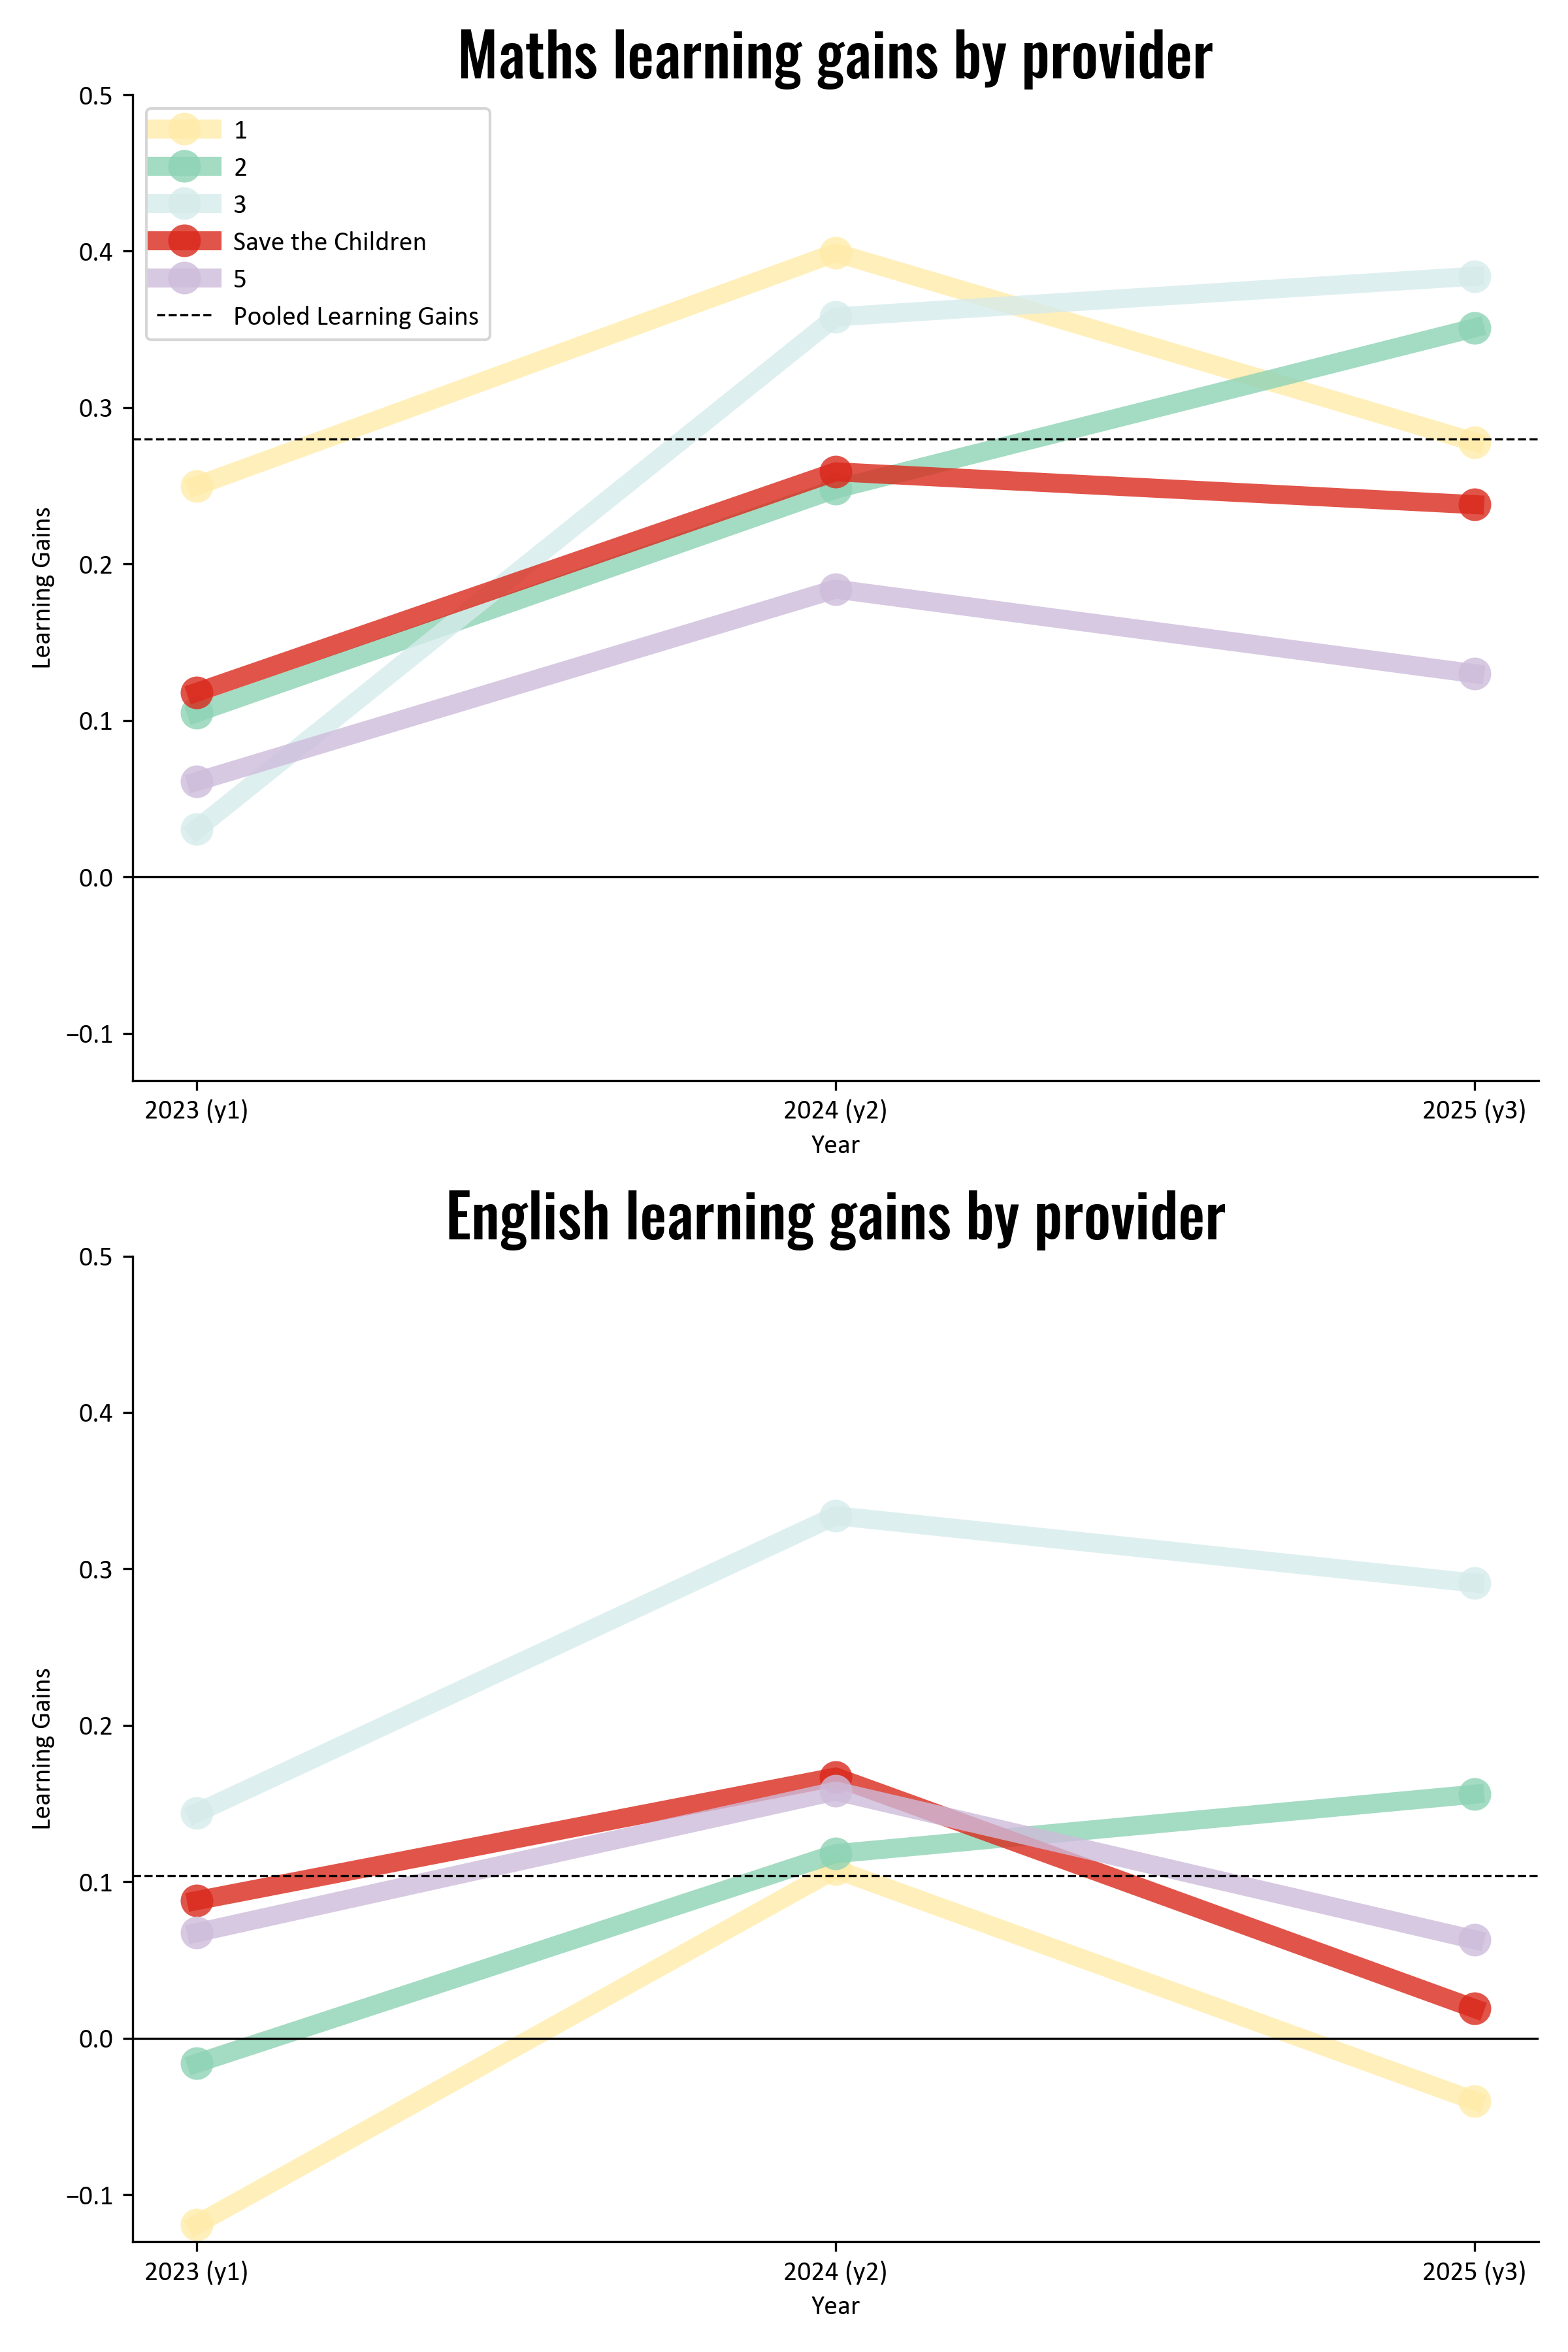
While the payment calculations are of course critical, and never more so than in the current development funding landscape, a comparison against other providers gives us more to learn from. It is rare for us to have the opportunity to directly compare ourselves to our peers who have worked in similar schools with similar resources and similar constraints. This gives us the (slightly uncomfortable) opportunity to answer the question; “could we have done better?”.
Looking at the data represented in Figure 3, the answer is (fairly) clear that we could have done better. Out of the five providers there are three who demonstrated larger learning gains relative to their control groups than we did. There is one provider (marked in green) whose mathematics learning gains did not reduce in year 3, and who achieved significant learning gains in English, and one of two along with lot 2 who managed to sustain gains from Year 2 to Year 3. We should be engaging with them to ask, what did they do that was different from other providers?
Figure 3 - Maths and English scores compared to other providers
3 A note on context
As was noted by EOF in their release, the SLEIC programme has taken place against a background of large declines in English competency in primary schools.
This is evident in the evaluation results, and has been validated using other metrics, such as pass rates in the West African Secondary School Certificate Exams (WASSCE). There is no clear hypothesis for what is driving these declining scores, but it is a topic of ongoing reflection and analysis.
Figure 4 - Mean scores for Maths and English
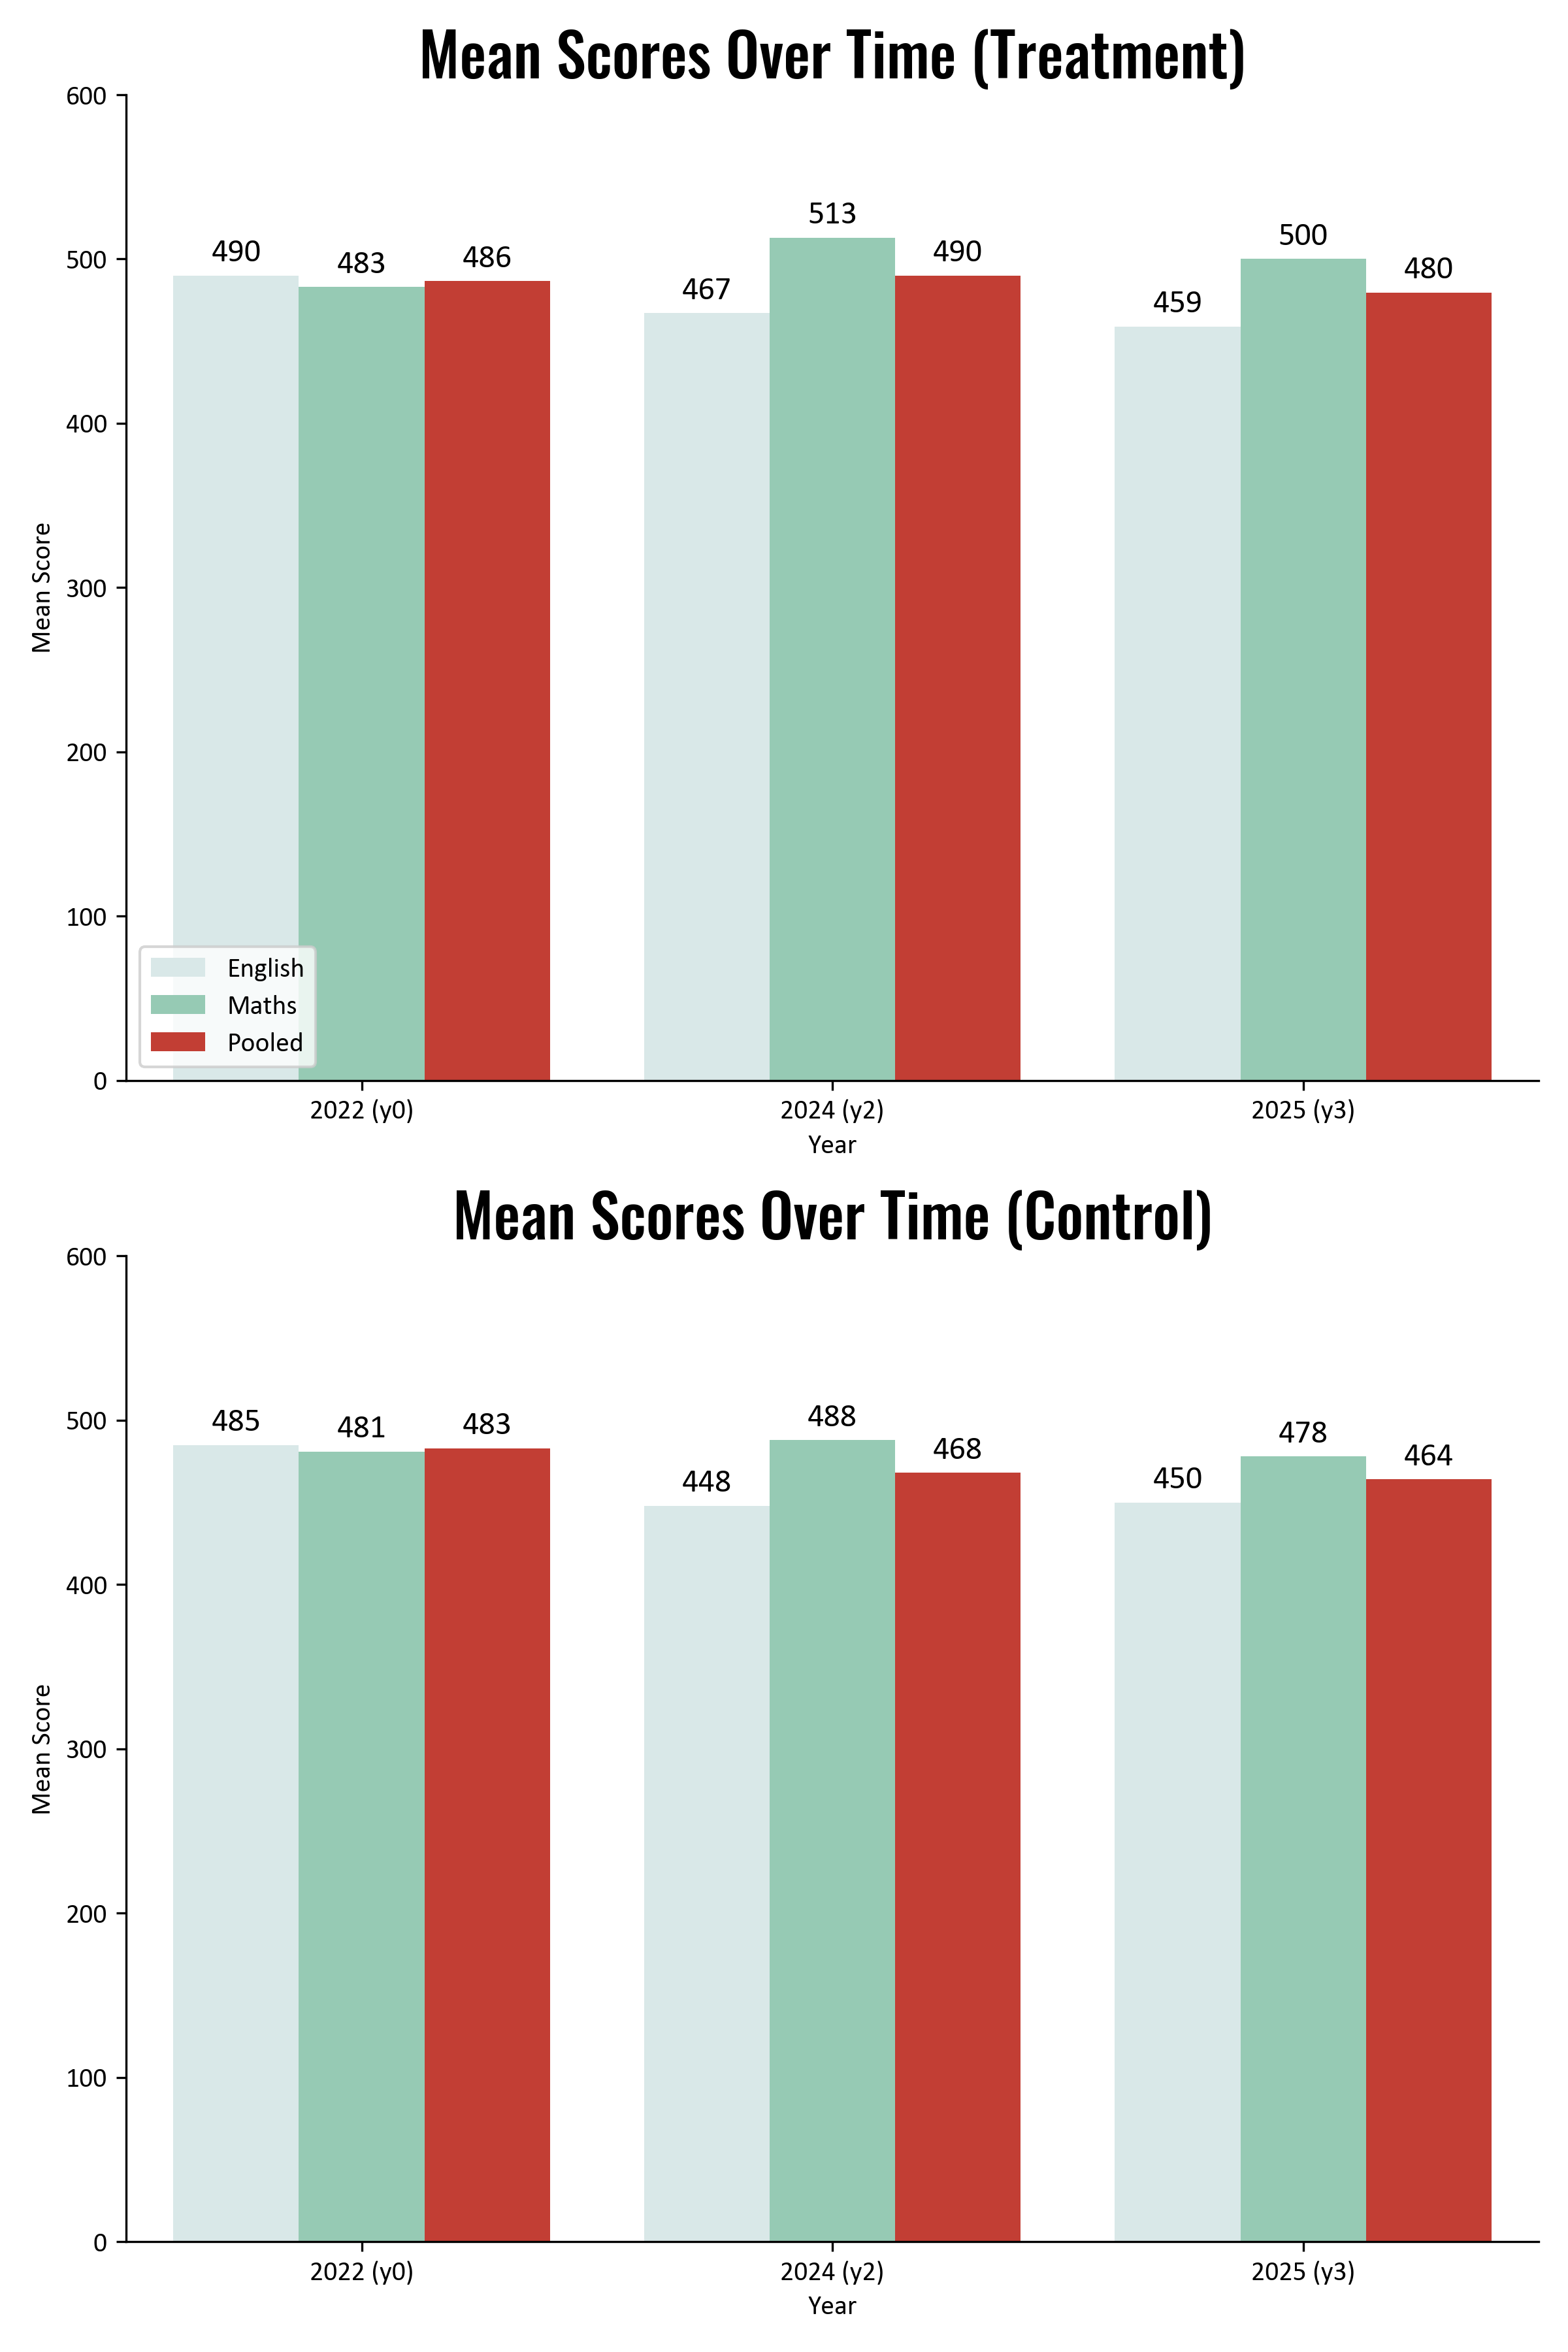
Looking at scores in schools we supported and control schools we can see that in Maths our scores were highest in year two, decline in year 3 but finished higher than at baseline. Control schools followed the same rise and fall pattern, but with less amplitude, and with final scores unchanged from baseline.
In English scores fell across years and in both treatment in and control schools. In treatment schools this decline was slightly smaller, but not enough to reverse the downward trend.
4 What do the results mean for children?
To give this data richer meaning we should look at how our work altered the learning trajectories of children in Sierra Leone.
In English, the observed learning gains are small and not statistically significant. In other words, we cannot be at least 90% confident that the difference between groups is real rather than due to random variation. Therefore, we do not consider these gains meaningful for interpretation.
In mathematics we can use our own baseline data, collected in November 2022 using the Annual Status of Education Results (ASER) tools for a random sample of children across all six grades of primary school. Using a standardised score, averaged across four domains[1], we can look at how an increase grade correlates to improved numeracy skills, as a proxy for the “business as usual” effect of one additional year of schooling. Doing this gives us a Grade Effect of .359 SD for each additional grade, controlling for age and sex (95% CI: 0.31–0.39, SE = .022).
This means that children in schools we supported are two thirds of a year ahead of where they otherwise would have been
This figure is lower than we would get if we used the standard of.15-.21 SD a year of schooling in Low and Middle Income Countries (LMICs) of provided by Evans & Yuan[2], which would give our results as having an impact equivalent to 1.1 to 1.6 years of schooling.
However, we prefer to use our original estimate as it is a) specific to numeracy gains, and b) specific to the schools in which we worked.
Ultimately this means that while we are clear eyed in our reflections on whether and how we could have done better, we also recognise that our presence in schools has had a tangible, real world impact on children and their learning trajectories. We are disappointed that we could not reverse the downward trend in English scores, but take solace in our achievements in Mathematics.
Another point of comparison are effect sizes seen in similar programmes. Evans and Yuan's review of evaluations of education interventions[3] finds the median effect size for numeracy programmes in LMICs to be .11 SD. This analysis would place our results somewhere between the 80th and 90th percentile of results from reviewed studies.
While by this measure our results compare favourably to sector wide norms, compared to our peers in the SLEIC programme it is clear there is more we could have done to support children’s learning. This is the point that is most important to us, as it gives us the greatest scope for learning and growing for future programmes.
5 Where to from here?
In previous blogs we have noted the need to move beyond the evaluation reports results in terms of outcomes of children’s learning to look at how and for whom change did (or didn’t take place). Understanding what changed in teachers’ practices and support structures for teachers in schools can help us to understand what has driven changes in learning outcomes. In the context of system wide declines we are asking ourselves what we could have done differently within the contexts of the system as it is.
We are lucky that in the SLEIC programme this process is helped by, a) the comparative nature and opportunity to learn from our peers, and b) the additional process study being conducted by the What Works Hub (WWH) to look at differences in endline teaching and learning practices in treatment and control schools.
In the new year we will publish:
- Our final reflections on what we have learned that can explain our results
- A summary of our approach to supporting Teacher Professional Development based on our own monitoring data, and the findings of the WWH research.
- The outputs of our learning agenda on our engagement with outcomes-based financing, and our view on the opportunities it presents for the education sector and particularly for (organisations like) Save the Children.
Throughout all of this we are committed to, and excited about the opportunities to lay our cards on the table, to learn from others and to share whatever we can that can help push honest reflection and more effective support to children’s right to a quality education.
- In case you missed it
Read our two previous blogs in this series on learning from SLEIC:
Reflections on year 2 evaluation results
Reflections on a final national learning event in Freetown
- Check our homework
All data and analysis contained in this blog is linked to below. Have a look and let us know what we may have missed.
Data and analyses
[1] Number recognition, addition, subtraction and multiplication (each scored 0 to 4 for beginner to four-digit operations)
")